Documenting Data in Practice
In this lesson you will learn
- How to create templates for different types of documentation
- What functions particular types of documentation can serve
- What “metadata” are, and how they relate to data documentation
Initial questions
- Thinking of a research project you are currently conducting, what types of data are you collecting (and will you thus need to document)?
- How will you organize the documentation you create for your data?
- Have you ever wondered how library catalogs and search engines actually find stuff?
Examples of Data Documentation
In this section we offer some examples of documentation you can create when engaging in two common techniques for collecting / generating qualitative data – archival research and human participant research (e.g., conducting interviews, focus groups, etc.). The examples should help illustrate how you can effectively document different types of data, and how doing so helps you to assess the quality and evidentiary value of the data. These examples are neither exhaustive nor prescriptive. Different research projects and different types of data will benefit from different types of documentation, and documentation in different formats. You should adapt the examples we offer to fit your project and your data.
Archive Research Logs
As you visit archives, you’ll review lots of materials. A research log is an easy way to make sure you keep track of what materials you have requested / reviewed, where you found them, and whether and how those materials are relevant to your project.
There is no single “right way” to keep a research log. You can use a simple Word template or an Excel spreadsheet, or you can adapt software such as Zotero as described here. What is important is that you develop a system that you find easy to use and that you stick to using it.
To offer an example, such a log might include information at two levels – the archive level and the item level – and could have the following types of information:
- Archive level
- Archive location
- Any relevant observations about the archivist / archive staff
- How you chose that archive
- Date(s) on which you visited the archive
- What types of search/finding aids the archive has / you used
- How you searched its holdings
- Which collections you searched
- Which boxes and folders you requested/consulted
- Item level
- Item name and/or code
- Box / folder information
- Date reviewed
- If / how you captured content (e.g., digital photos or scans, photocopy, notes)
- If you only captured part of the content (e.g., copied one page of a five page document), what did you leave out and why
- Relevance to your project
If you are able to create digital images of archival materials, be sure to follow a consistent file and folder naming strategy that allows you to easily shift back and forth between your digital images and your research log. Some of this item-level identifying information (e.g., name, box, folder) should be included in file names. (Alternatively, you may develop a coding system for these items, and include the relevant code in, or use it as, the file name.) Each folder could represent a particular day in the archive, or your folders could mimic the archive’s organizational structure. See this excellent blog post by Donna Campbell for additional suggestions on developing effective workflows for archival research.
Keeping track of all of this information will help keep you organized, and help you to avoid duplicating effort (yourself, or within your research team). Doing so will help you to correctly reference the materials you consulted as you write up your research down the line. Finally, keeping a log allows you to present a list of all of the materials you consulted, helping to substantiate a claim that certain information cannot be found in the records. We strongly suggest that you create your log as you go, keeping it as current as possible.
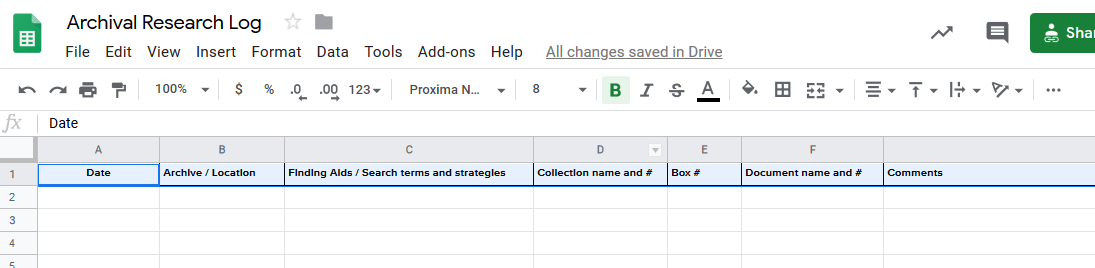
A sample spreadsheet for use as an archive log. You can access this template here.
Informal Documentation for Interactive Data Collection
Many researchers who generate their own qualitative data do so through interacting with human beings – engaging in ethnographic work, conducting interviews, holding focus groups, and so on. No matter whether you conduct three interviews or embed yourself in a field site for a year, you need a way to keep track of the people with whom you interact, the content of those interactions, and your observations about those interactions.
For at least some of these interactions, you will create formal documentation in the form of transcripts of audio / video recordings of an interaction. We discuss this documentation in the lesson on Transforming Data. Here we consider something related but distinct – “informal documentation” for such interactions, i.e., practical information and your observations and reactions about the interactions You can include this information as part of the record of the content of the interaction – as a header at the beginning, and/or notes at the end, of your transcription of / notes from the interaction. We strongly suggest that you create this informal documentation during the interaction, and/or as soon after the interaction as possible.
Creating this informal documentation serves two purposes. First, transcripts and notes from interactive data collection are much richer sources of data when you can vividly remember the exchange: being able to “re-attach” the sights and sounds and emotion of an interaction to a document containing its text helps you to contextualize and interpret the data. This informal documentation helps you to do that. Second, recording this information enables you to more effectively assess your confidence in, and the evidentiary value of, the data, and thus more effectively and appropriately deploy them to support claims and conclusions in your research product.
Informal documentation of an interaction could include practical information such as:
- How the respondent(s) was / were identified / selected
- Code (number) or pseudonym for the respondent(s)
- Date of interaction
- Start time of the interaction
- End time of the interaction
- Location
- Language
- Format of exchange (e.g., semi-structured in-person interview; focus group)
- What you and the respondent(s) agreed to with regard to confidentiality, and with regard to data sharing, through the process of soliciting their informed consent to participate in your study
- Whether you took notes, recorded, or both
- Suggestions made about your study / other human participants
- Any follow-up that needs to be done (for instance, because a respondent promised to send you something)
- Date on which you sent a thank you note
Informal documentation of an interaction might include the following with regard to observations and reactions about the exchange:
- A description of the context of the exchange - E.g., “the very tall congressman’s very messy office, with overflowing bookshelves, three desks, and a view to the capitol out the window behind where he sat”
- The overall rapport or tone of the exchange
- Particular points in the exchange when the respondent(s) displayed any sort of emotion (sadness, exuberance, stress, anxiety, frustration, etc.)
- Particular points in the exchange at which you were not sure the respondent(s) was/were revealing the full story; could recall the full story; was being fully forthright
- The level of access the respondent(s) had to what they were discussing or describing - E.g., whether they had first-hand knowledge of the events or phenomena being described or had heard about them second- or third-hand.
- Any information (perhaps from other human participants) regarding the respondents’ track record in terms of reliability
- Key take-away points from the exchange
- Particular aspects of your research in which you can foresee using the information
Exercise
Creating Templates
- Amend the template archive log we offered above in a way that will make it more useful for your project, or create a template for “informal documentation” for a form of interactive data collection in which you are engaging or will engage. Make sure to think hard about what information particular to your project you want to systematically collect. Then choose one of the options below:
- If you are working independently, consider whether, realistically, you will use your template – is it so complicated that you are unlikely to stick with it? Also, imagine yourself six to nine months in the future trying to remember the data-collection context. What is your template missing that would help you re-conjure that context?
- If you are taking this course at the same time as someone else whom you know, exchange templates, and critique each other’s. What do you find particularly valuable / useful about your partner’s template? What is missing? What is extraneous?
From Documentation to Metadata
Metadata are simply “data about data”. Alternatively you can think of them as highly structured documentation. You interact with metadata in your research (and beyond) all the time:
- When you search a library catalog for works by a specific author, you use MARC (MAchine-Readable Cataloging) metadata, generated by a librarian.
- When you post an article to social media and it appears with a small image and a short description, this relies on “Open Graph” metadata, embedded into the webpage you’re posting.
- When you search Google scholar for an article, you rely on a mix of metadata (“Highwire”) embedded by the publisher in the article’s webpages and Google’s automatic processing of that metadata and additional information it retrieves from the article.
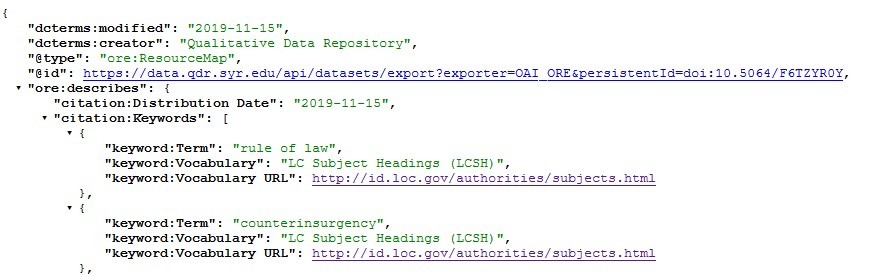
Extract from a metadata entry for a particular data project shared via QDR (here: OAI-ORE JSON).
To quickly reassure you – you are typically not responsible for creating the metadata for your data. Just like libraries generate the metadata for books used in library catalogs, data repositories and their curators usually generate the metadata for your data once you deposit them. There are two ways repositories do this:
All repositories prompt you to input some information about your data project and your data in different “fields” of the deposit form when you are depositing your digital data. These fields are then automatically mapped to relevant metadata formats.
For data repositories that curate your data (i.e., domain repositories and some institutional repositories), curators work to improve the metadata for your project by ensuring that depositors have input the correct information in each field in the deposit form, by soliciting additional information, and by enhancing existing information, e.g., by adding systematic keywords.
The most important metadata format in the social sciences is the “Data Documentation Initiative” (DDI). DDI provides detailed categories for describing most social science studies. Originally designed for survey research, its most distinctive feature is the ability to include variable-level metadata. Using DDI metadata, it is thus possible to search the catalogs of repositories such as ICPSR for specific variables.
While creating metadata is not your responsibility, the better and more complete your data documentation is, the better and more useful the metadata that can be created based on that documentation. The quality of your data’s documentation and metadata matter in several ways. Well-structured metadata make data more findable. The availability of detailed information about how data were generated make them more trustworthy for secondary users. The availability of background information on the project and the data make the data more understandable. All of this makes the data more useful for other scholars.
Exercise
Comparing Documentation / Metadata
- Compare these data on figshare with these data on QDR. What are some of the differences in terms of the quantity and the quality of documentation? Which data do you feel like you have a better feel for – and will be better able to interpret – even before looking at the data? What is it about the metadata and documentation that helps you most?