Research Transparency and Qualitative Data
In this lesson you will learn
- Three aspects of transparent social science research
- Some approaches to making qualitative social science research more transparent
- How you can achieve transparency through using Computer-Assisted Qualitative Data Analysis Software (CAQDAS)
Initial questions
- What would you need to know about a particular piece of research in order to fully evaluate its quality?
- Can you think of some great examples of transparent research in your field?
- What are some exemplary practices for making research transparent that are used in your field?
Transparency in Social Science Research
Norms across the social sciences are evolving to encourage greater access to the data underpinning research, and more transparency with regard to research practices. The goal of this norm change is to make scholarly work more easily understood and evaluated. Transparency in social science scholarship includes three dimensions (we draw here on the formulation of the American Political Science Association [2012, 9-10]).
- Data access: achieved by referencing the data that underpin evidence-based knowledge claims and, if you generated or collected those data yourself, sharing those data or explaining why you cannot do so.
- Production transparency: entails offering a full account of the procedures used to collect or generate your data (if you did so yourself).
- Analytic transparency: involves providing a full account of how you drew inferences from the data, i.e., clearly explicating the links between your data and your empirical claims and conclusions.
A similar set of principles, originating in psychology and advanced by the Center for Open Science (COS), are the Transparency and Openness Promotion (TOP) guidelines. They include eight areas in which journals can promote transparency, including data transparency, design and analysis transparency, and analytic methods transparency, broadly corresponding to the three dimensions above. More than 1,000 scientific journals have adopted the TOP guidelines into their editorial practices.
While transparency is relevant for all types of social science research, different evidenced-based research traditions have developed, and will continue to develop, different strategies to achieve transparency. In particular, the strategies devised to achieve transparency differ between quantitative and qualitative research, in large part because data are deployed differently in these distinct types of inquiry (see the previous lesson in this module on Deploying Qualitative Data).
Nonetheless, all such strategies for achieving transparency should:
- Make relevant data and analytic information immediately available in tandem with the particular knowledge claim they were used to generate (proximity)
- Make data and analytic information FAIR (findable, accessible, interoperable, and reusable, Wilkinson et al. 2016)
- Address concerns about the ethical and legal complications that constrain openness (protection).
For qualitative research, optimizing proximity entails linking digital data sources (e.g., archival documents, audio-recordings, interview transcripts) and accompanying materials containing relevant analytic information directly to the passage in a digital publication that they support, and accessible from a journal’s web page (i.e., on the publisher’s platform).
Rendering data and analytic information FAIR entails tasks such as describing them with the proper metadata and assuring their long-term preservation. Data repositories have the expertise and technology to help you to render, and keep, your data FAIR as standards evolve over time.
Finally, as lessons two and three of the Sharing Qualitative Data module suggest, a promising way to maximize transparency while simultaneously addressing the ethical and legal complications that sharing social science data can present – in particular protecting human participants and respecting copyright law – is by establishing differential access to the evidentiary base of published articles.
Annotation for Transparent Inquiry (ATI)
Annotation for Transparent Inquiry (ATI) is a new approach to increasing the transparency of qualitative research. ATI was developed specifically with the challenges discussed in lesson 1 of this module, and the goals just outlined, in mind. ATI facilitates transparency by allowing you to add digital annotations to specific passages of a book or article manuscript, thus linking additional explanation and/or underlying data directly to particular empirical claims. Ultimately, the annotations appear right beside the text of the article or book on the publisher’s web page. You can see a visual representation of ATI here.
Each annotation includes one or more of the following:
- Full citation to the underlying data source(s) and, when relevant, supplementary information about the source’s location;
- Source excerpt(s): a quote (or redaction) from a textual source (including the transcription of handwritten or audiovisual material), typically 100 to 150 words;
- Source excerpt translation(s): a translation (and its source) if the excerpt is not in the language in which the manuscript is written;
- Analytic note: discussion of the context of the source(s), how the source(s) were collected, how data were generated, how that source/data support conclusions/claims in the annotated passage; and potentially how ethical and legal complications inhibit the sharing of the underlying data source(s);
- Link to the underlying data source(s) when these are digital and can be shared ethically and legally.
ATI empowers you to demonstrate the richness, rigor, nuance, and validity of your inferences and interpretations, amplifying your research products. Annotations make immediately available to readers information about how you generated and/or analyzed the underlying data, thus enabling research transparency. They can also facilitate data access by serving as a link between a claim you made in the text of an article or book and the data source(s) underlying that claim.
An “ATI Data Supplement” for a particular manuscript comprises the set of digital annotations that you created, as well as an “ATI Data Overview.” This overview, of approximately 1,000 words in length, discusses the various data generation procedures that you employed, and how the analysis attends to the rules of inference or interpretation that underlie the qualitative methods that you employed.
Employing ATI benefits you, and your qualitative inquiry, in several ways. Employing ATI:
- permits you to display critical evidence supporting your claims;
- encourages you to be more careful and precise when making and supporting evidence-based arguments;
- helps you to meet transparency standards;
- facilitates evaluation of your work by reducing transaction costs for readers who seek more information about how you drew descriptive or causal inferences, or developed interpretive claims, or who wish to investigate whether the information contained in cited sources supports evidence-based claims.
Some models of scholarship that has been annotated using ATI can be found here.
Using ATI
Engaging in the various organizational and documentation steps discussed in previous modules will help you to use ATI yourself. Authors who have used ATI consistently report that identifying and locating the information to include in annotations is by far the most labor-intensive part of ATI. Good data management will significantly reduce the time you need for that. QDR can help you if you wish to use ATI in your work. The repository has designed the ATI creation process so that you can annotate your manuscript in any format you’re comfortable with: using Word comments, PDF annotations, LaTeX comments, etc. QDR then converts your notes to open annotations. You can find more detailed instructions for using ATI here.
Exercise
ATI (1) -- Considering Another Author’s Annotations
- Find this article on-line and then follow the steps below: O’Mahoney, Joseph. 2017. “Making the Real: Rhetorical Adduction and the Bangladesh Liberation War.” International Organization 71 (2): 317–48. https://doi.org/10.1017/S0020818317000054
- Click on the Adobe Acrobat icon to download the PDF.
- Read the abstract.
- Scroll to a section called, “The Role of Troop Withdrawal” on p. 332 and read the first two paragraphs of that section.
- Given what you have learned about ATI, which passages of those paragraphs would you expect to see annotated and with what type of content? Use your PDF viewer’s annotations functionality to highlight them.
- Now view the same article with ATI annotations here. Find the same two paragraphs and compare your expected annotations with those of the article’s author, Joey O’Mahoney.
- How do the author’s annotations differ from your expectations?
- Why do you think they differ?
- How do the annotations affect your assessment of the underlying claims?
Exercise
ATI (2) -- You Try It!
- Using a research product you recently completed, choose three contiguous pages that contain multiple evidence-based claims. Do you feel that you were able to substantiate all of those claims as well as you wished? Some of them? Few of them? If your answer is “some” or “few,” was part of the challenge space-limitations? If so, try to remember additional information or evidence that you cut as you were revising the piece, and use that information to annotate a few passages in the piece, following the description above and the directions here. Consider what was easy and hard about that process. Ask yourself what you are gaining – and what you may be losing – through annotation.
Data Appendix
No matter how you collect and generate data, production transparency requires you to communicate to readers as much about your data-gathering processes as you can. While your processes were likely varied and intricate, you need to convey them holistically and synthetically, while simultaneously offering sufficient detail for a reader to understand and evaluate what you did. ATI empowers you to give a “macro-representation” of your data collection through the Data Overview, and a “micro-representation” of your data collection through annotations.
A data appendix, by contrast, offers a “meso-level” representation: an “itemized overview” of respondents, documents, or other data sources on which you drew in a particular piece of scholarship, with each described via a structured set of attributes. Your data appendix might include a subset of the data sources included in your “data-source manifest,” described in the previous lesson, with each item described in more detail. If you didn’t use ATI, your appendix should also include a holistic overview of the type you would have written in your ATI Data Overview detailing, e.g., how data sources were chosen.
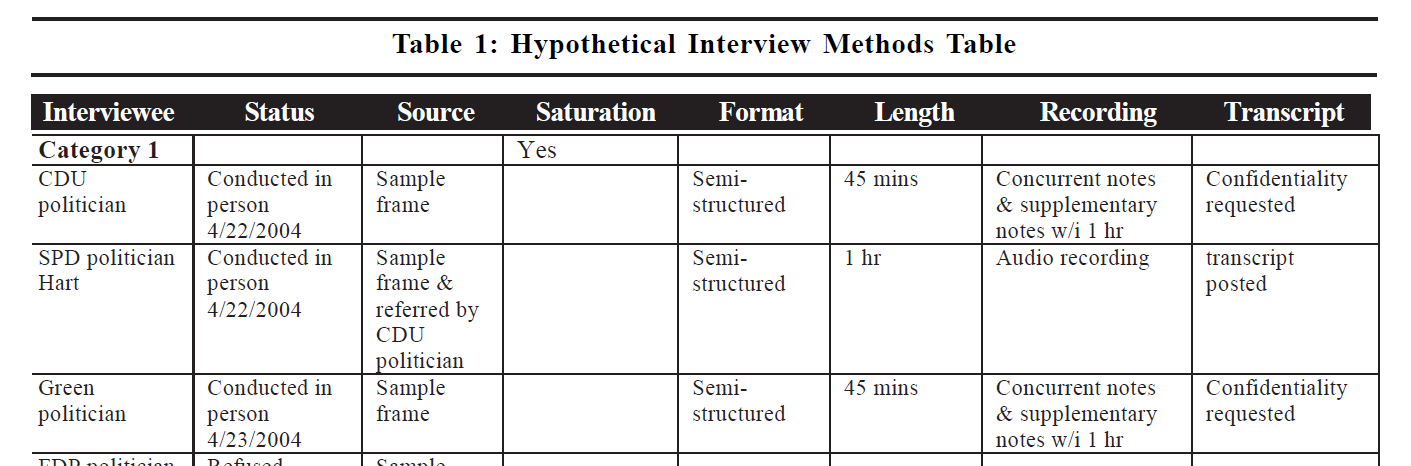
We describe here, as an example, one element that might be included in the data appendix to an article based on human participant research (i.e., interactive data collection), drawing on an excellent example developed by Erik Bleich and Robert Pekkanen (2015). In projects involving interactive data collection, with whom you interacted (and why), and how you solicited information from them, are key drivers of the data that are produced, and thus of your analysis and findings. Being transparent in this kind of research, then, entails providing as much information as you can about how you selected your interlocutors, and your interactions with them.
In our lesson on Documenting Data and Creating Metadata, we suggested that you create “informal documentation” for each interaction with a research participant. Creating a data appendix entails aggregating certain aspects of that informal documentation into a holistic depiction of your interactive data collection. You probably won’t include in your appendix everything you noted in this informal documentation; you should choose the information that you think will allow your readers to evaluate the quality and evidentiary value of your human participant data.
Bleich and Pekkanen provide a template for creating this type of data appendix element – what they term an “Interview Methods Table”. Such a table includes key information about each respondent and each exchange. (“Saturation” refers to whether an exchange revealed any new information, and/or whether a particular category of respondent has reached “saturation” such that no additional interviews are required.) You might include other key information such as the date and location of the exchange.
The exact content of your data appendix depends on your research project and the types of data collection in which you engaged. The key is for it to help readers of your published work to understand to the greatest degree possible how your data collection processes produced the data that underpin your work, thus helping them to assess the quality of the data and how well they can support your claims.
Exercise
Data Appendix (1) -- Considering Another Author’s Appendix
- Look at Erik Bleich’s article “Historical Institutionalism and Judicial Decision-Making: Ideas, Institutions, and Actors in French High Court Hate Speech Rulings” and its accompanying Interview Methods Appendix (scroll to Appendix B). Also, open the data for the article on QDR. Quickly skim the article, and read more closely through the narrative for 1993 to 1997 starting on page 70, focusing in particular on claims made based on interview evidence. Look up the notes for the cited interviews available on QDR. What does the availability of the interview methods appendix add? Do the interview notes help you better evaluate the quality of the inference that is based on interviews?
Exercise
Data Appendix (2) -- Now You Try!
- Draft the framework for a data appendix for a research product you are currently creating. What set of attributes would work across all of your different forms of data (documents, interviews transcripts / notes, etc.) and help your readers understand and evaluate your project’s evidentiary foundation?
Qualitative Data Analysis Software and Transparency
The use of software to assist qualitative data analysis (sometimes referred to as CAQDAS or “Computer Assisted Qualitative Data Analysis Software”) is becoming more and more common across the social sciences. (See the lesson on organizing data for more on CAQDAS and related software). Such software assists researchers with routine tasks such as coding, categorizing, and annotating documents. Different from statistical packages (and as including “assist” in the name suggests), the analysis itself does not take place in the software: you, not an algorithm, make key analytic choices such as which code to assign to a statement. As a result, simply sharing some code or output does not satisfy requirements for analytic transparency. Nevertheless, sharing some of the output the software creates may be one element in your broader efforts to make your work transparent.
We offer here some suggestions on achieving transparency when working with CAQDAS software
1. Follow General Advice on Data Management
Most advice for managing qualitative data in order to facilitate their subsequent sharing is applicable to CAQDAS data: make sure the data have a clear organizational structure, write clear documentation during data collection, etc.
2. Keep Track of Sensitive Information
As you collect your data, keep concerns about privacy and sensitivity in mind. As you identify information in your data that may need redacting, use the software to highlight it, so you can quickly re-locate it later on. Also consider tagging files that you specifically cannot share (e.g., interviews given “off the record” or signed consent forms).
3. Keep Memos about Analytic Decisions
As you analyze your data, your CAQDAS tool will help you make your analytic process transparent. Making coding and analysis decisions explicit in memos that you ultimately share will help readers to evaluate your conclusions, and also help secondary users to better understand the application of given codes in your data.
4. Preparing Your Data for Sharing
Make a copy of your project and delete any information you do not want to share, such as private notes or sensitive information. If you have followed our advice above, you can now use the tags you have created to redact potentially identifying information from transcripts following the guidelines we provided previously.
5. Exporting Your Data for Sharing
One of the challenges of sharing CAQDAS-produced data is that every software product has its own, typically proprietary, export format. These formats do not travel between software, may change between software versions, and are thus problematic for sharing and archiving.
One solution is to share data in two different forms. The first form is the raw full export from your software. Once your data are prepared for sharing, first export the whole project into your software’s dedicated export format (e.g., .nvp for NVivo, “Export Data” for Dedoose, or “copy bundle” for atlas.ti). Then, create a second “human-readable” export that anyone, regardless of software, can use: Export all relevant files in widely used formats (such as RTF, PDF, Excel, as well as widely used video, image, and audio formats). Also export all relevant memos as RTF or PDF files.
As of this writing, efforts are underway to provide a standardized format for exchange between different CAQDAS software products. As this exchange format matures and becomes more widely available, we expect it to replace some of these recommendations.
Further Resources
- Article in Science (ungated) by Brian Nosek et al. introducing the TOP guidelines
- Bleich, Erik, and Pekkanen, Robert. 2015. “Data Access, Research Transparency, and Interviews; the Interview Methods Appendix.” Qualitative & Multi-method Research 13 (1): 8–13. https://doi.org/10.5281/zenodo.892386
- Elman, Colin, Diana Kapiszewski, Andrew Moravcsik, and Sebastian Karcher. 2017. A Guide to Annotation for Transparent Inquiry. https://qdr.syr.edu/ati/guide-to-ati