Deploying Qualitative Data
In this lesson you will learn
- The structural differences between how quantitative data and qualitative data are deployed in social science inquiry
- The utility of creating a “data-source manifest”
- The implications that those differences have for the way in which you think about and draw on the qualitative data you have collected and generated as evidence in your work
Initial questions
- How can you keep all of the data that you collected or generated in mind when writing your research products?
- What does it mean to think of your qualitative data as a “dataset”?
- How can you choose which data to deploy in your analysis from among all of the data you collected and generated?

Structuring Data Deployment: Quantitative vs. Qualitative Inquiry
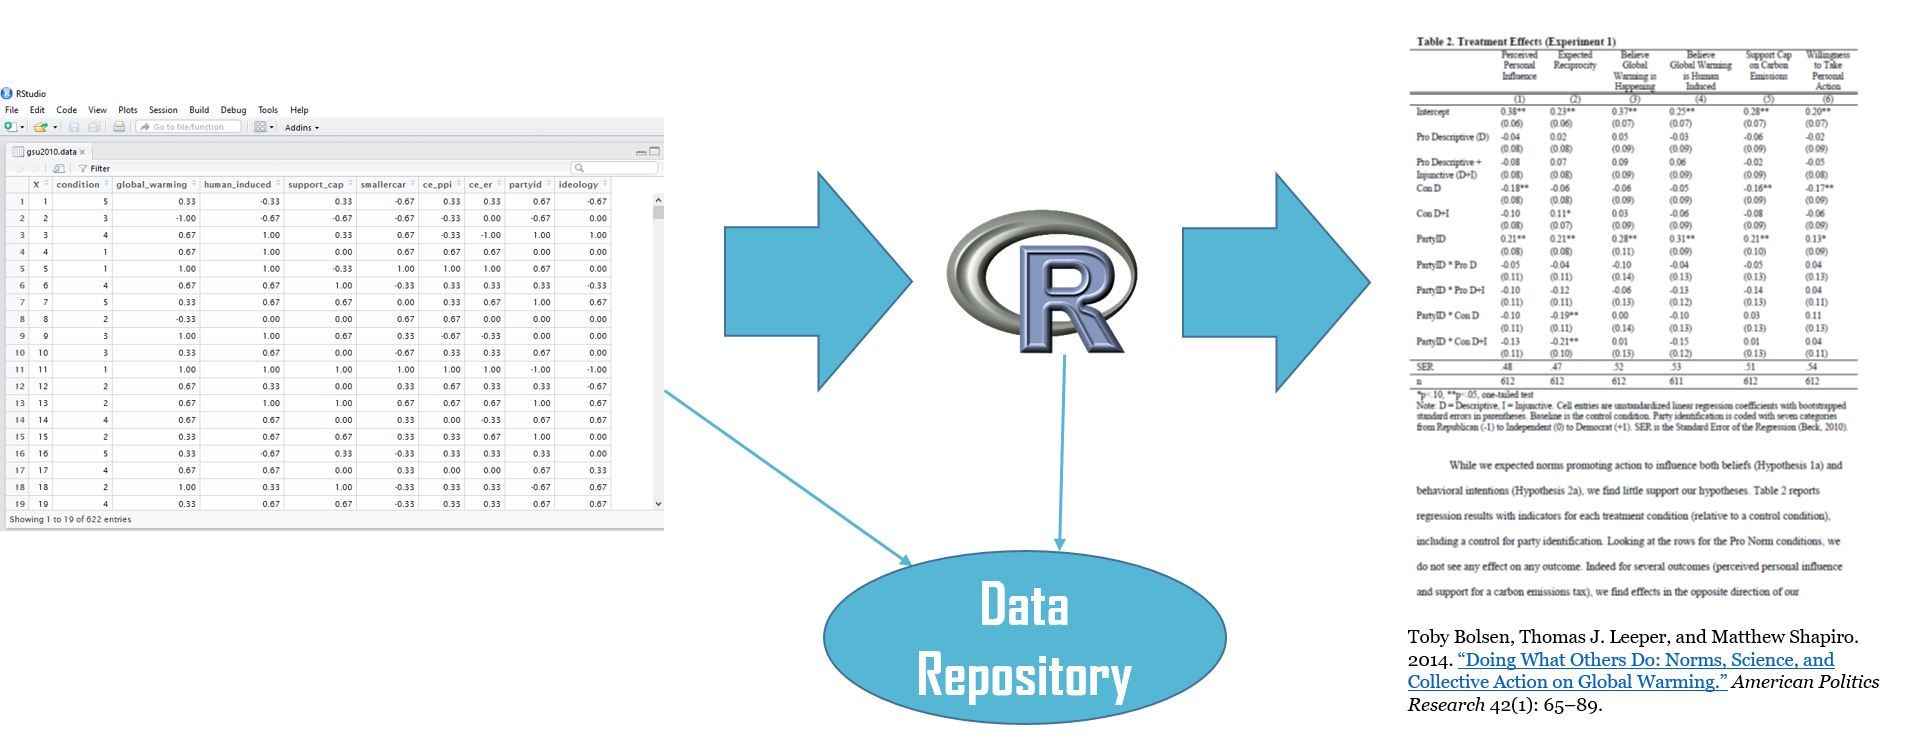
The strategies and methods used to analyze quantitative data are different from those used to analyze qualitative data. Typically, in quantitative and computational social science, numerical data are arranged in a matrix and analyzed as an aggregate body of information. In published work, the analysis is often summarized in tabular form in the text or appendix (see Figure 1), and the study dataset (and relevant information about its creation) and the do-file used for analysis (i.e., the “code”) provided as supplemental materials.

Figure 1. Quantitative Research – Matrix Data
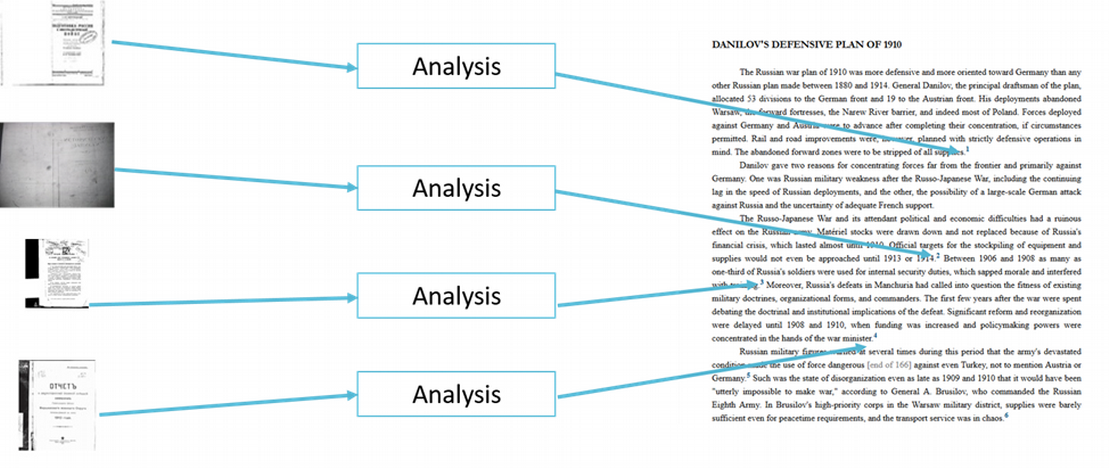
Qualitative data and analysis work differently. Qualitative data (e.g., text, images, audio, video) are typically analyzed, and used to support claims, individually or in small groups. The content of each cited source (e.g., book, archival document, interview transcript, newspaper article, video clip, etc.) serves as a distinct input to the analysis. Moreover, data, analysis, and conclusions are densely interwoven across the span of a book or article (see Figure 2).

Figure 2. Qualitative Research – Individual Pieces of Data
Toward Effective Deployment of Qualitative Data
The ways in which qualitative data are deployed in social science inquiry have implications for how you select which of the data that you collected or generated you will use as evidence in your written research products. We offer some suggestions for effective data deployment below.
These suggestions in no way constitute or replace a discussion of analyzing qualitative data. The literature on methods for analyzing qualitative data (e.g., in political science, process tracing, comparative qualitative analysis [QCA], and others) has been growing by leaps and bounds in the 2000s. Our suggestions here complement those methodological discussions, helping you to decide which of your qualitative data – whether or not you have formally analyzed them – to deploy to support and develop your claims, conclusions, and argument.
1. Know your data. It is challenging for scholars who have collected and generated dozens or hundreds of discrete data sources to remain familiar with all of their data. Yet doing so is crucial to the writing process. In aggregate, those data help you formulate your ideas and arguments; individually, they serve as evidence supporting particular claims. Keeping your data extremely well-organized, as discussed in detail in the modules on “Planning the Management of Qualitative Data” and “Managing Qualitative Data,” is a critical first step toward remaining familiar with your data. But you likely need to do more.
Review your data every once in a while by glancing through your sources, refreshing your memory of what they say, tell you, and mean. Even more actively, you might “take inventory” of your data periodically, creating a (running) manifest of your data files. If you have created an “archive log” (as discussed in Module 2), or if you have been keeping an annotated list of the human participants in your research, you already have the beginnings of such a manifest.
A data-source manifest is best created using spreadsheet software. Each row represents a particular data source (an interview transcript, an archival document). Columns include relevant attributes of each file – some logistical, some substantive – for instance:
- form (e.g., document, transcript)
- format (e.g., wav file, PDF)
- if digital, a link or an indication of where the data source is on your computer
- author (for a document) or respondent (for an interview)
- date collected / generated
- location collected / generated
- transformations performed (e.g., transcribed or translated)
- very, very, very brief summary of content
- what type of evidence the item contains / how it fits with your analysis (e.g., “can help measure independent variable” or “evidence of societal support for immigration reform”)
You can find an example here.
Your manifest should be in a form that is easily accessible to you (perhaps a Google sheet pinned to your bookmarks toolbar). It should also be expandable so you can add data sources as you collect them. Your manifest should also have some organizational logic that will make sense to the “future you” who will be deploying the data listed in the manifest later in time; you could jot down this logic in a separate “Manifest Notes” tab in your spreadsheet. Bottom line: it will be much easier for you to identify evidence for (and evidence against!) the claims that you wish to make in your scholarship if you remember that you possess, can easily find, and can instantly have at your fingertips, all of your data sources.
2. Begin to think of all of your qualitative data, together, in all their varied forms, as a dataset. Your data are composed of words and images, but they still comprise a corpus of information with an underlying theme and an organizational logic. You may deploy your data individually or in small groups, but implicitly or explicitly you will be analyzing larger subsets of the data as you build your argument. Thinking of your data holistically will also remind you that you need to consider how all of your data intersect with what you are writing – that you need to identify and mention in your work data that support your claims as well as data that contradict them. This holistic vision helps you to avoid tunnel vision, focusing only on the data that support your conclusions and argument.
3. The anchor point for data deployment should be the text that you are writing, not the data. You love your data – they were hard to collect! That fondness, and knowing them inside and out, may inspire you to seek to find a home for all of them in your work. Resist that urge. Your intellectual goal is not to use as much of your data as possible in your analysis. Instead, your goal is to carefully deploy the data that most effectively support the particular claims and conclusions that form the building blocks of your argument as well as any data that you have collected that run counter to your claims, conclusions, and argument. This approach helps you to make assertions, claims, and conclusions with the appropriate degree of certainty.
As you write and construct your argument, have your data-source manifest at hand. When you discuss contested, controversial, or less-well-known empirical facts; when you make empirical assertions and claims; and when you draw empirical conclusions, consider how you will best support them with your evidence. You will leave a great deal of your data un-deployed or under-deployed; very few scholars cite in their work all of the data they collected. Even the data you do not cite have likely informed your thinking and reasoning however – and, of course, remain available for future analyses and projects.
Exercise
Can You Find Your Sources?
- Take two pages of something you are currently writing based on qualitative data and analysis (or something you wrote in the recent past), and consider how easy it would be for you to quickly identify and get your hands on the sources needed to support a few of your claims.